
Overview
Quantitative analysis of 3D spheroid/organoid microscopy images to measure morphology and fluorescence/intensity statistics in user-defined offset regions (e.g., shells/rings around a spheroid). Designed for both biologists (easy-to-run workflow, clear outputs) and image-analysis users (tunable segmentation parameters).
- Links: Github
- Status: Complete
Why this project
This project provides a simple MATLAB workflow to segment spheroid/organoid images and quantify ROI intensity metrics (including user-defined offset regions) with results exported to Excel for fast, reproducible analysis.
Highlights
Given a single-channel .tif image containing a spheroid/organoid, the pipeline:
- Segments the spheroid region of interest (ROI)
- Optionally fills holes / removes small noise components
- Computes intensity metrics within the ROI and within regions defined by an offset length
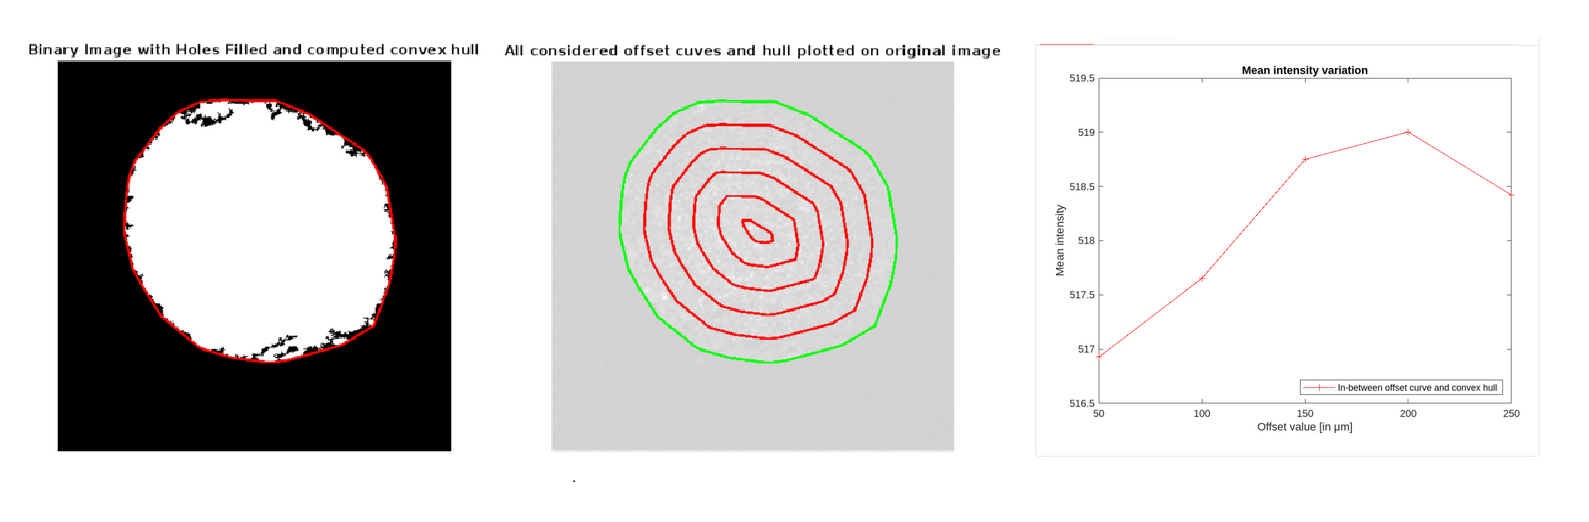
Figure 1: Sample image analysis pipeline
Result
The program exports an Excel file including: - Offset value (μm) - Area of ROI (pixels) - Total / Integrated intensity - Mean intensity - Median intensity - Standard deviation of intensity - Maximum intensity
How to run
- MATLAB (tested in a standard MATLAB environment)
- Input images must be TIF/TIFF (.tif) format
paCurrent workflow assumes images have equal height and width (square images), or at least the same pixel count in both directions.